Durable causal debugger
Follow an accepted result back through its assignment, process and configuration. Inspect a worker that stayed disabled after reboot, then keep its offline evidence visibly historical.
These are recordings of the installed why application running in real SlOS guests. The browser, CLI and read-only evidence listeners are host-compiled Hew user programs over the generic SlOS SDK. This page presents captured media; it does not connect to a running guest.
01 - Follow a completed job through durable receipts
Submit actual distributed work, check the resulting pixels, follow its connected receipts, inspect an exact storage publication and download the explanation.
93.00 seconds. Continuous 1920 × 1080 capture at 20 fps and 1× speed. The guest-served browser, coordinator serial, worker serial and operator log are simultaneous. Local synthetic Kokoro narration and on-screen captions accompany the unchanged screen timing. Use fullscreen to read the consoles.
Download MP4 · WebVTT captions · Recording proof and checksums
Narration transcript
This is the installed SlOS causal debugger. The browser is served by a real Hew user program. At right are the simultaneous coordinator and worker consoles, and the host operator log.
I submit a small render job and enrol this worker. The two native SlOS guests exchange actual assignments and calculate the pixels. An independent reference checks the finished image.
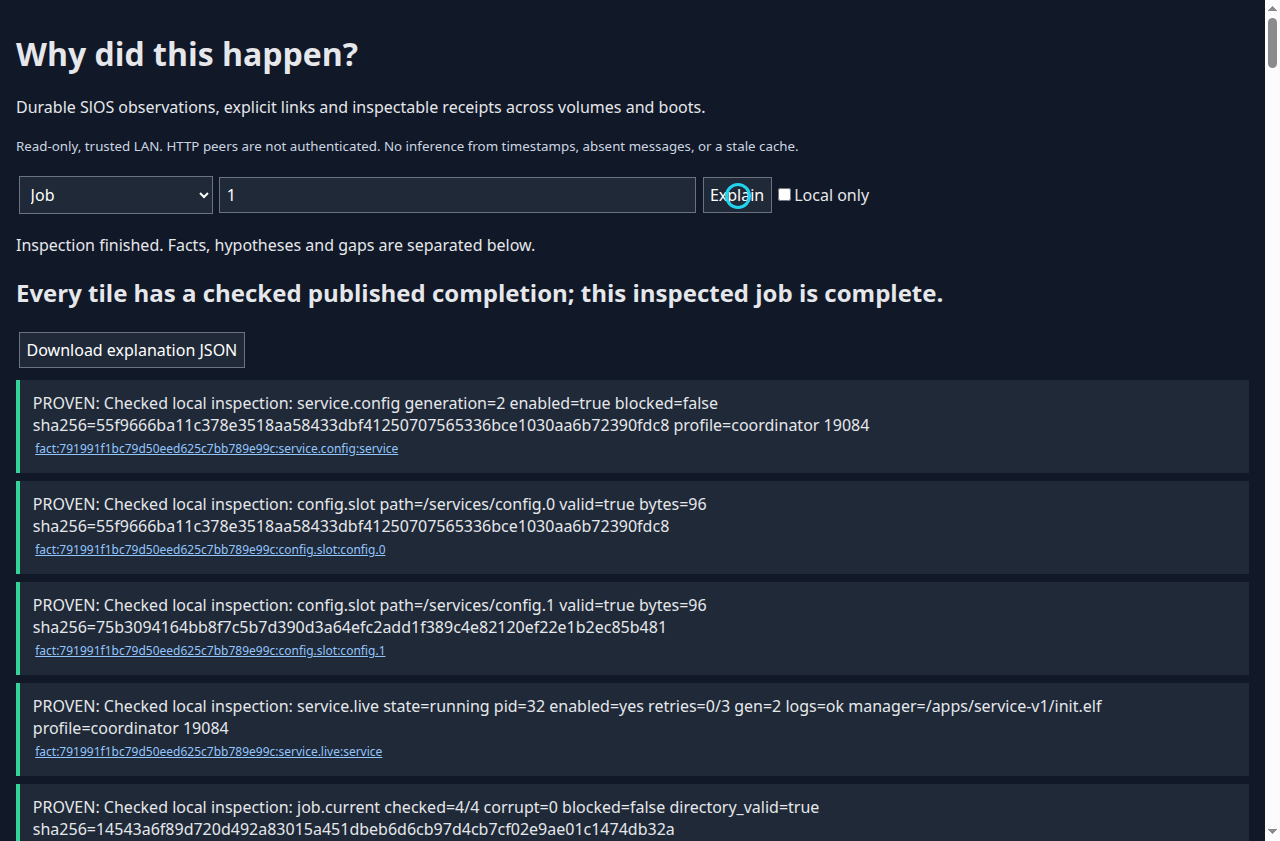
The job is complete because every tile has a checked published result. Local inspections are marked proven. Remote HTTP reports remain plausible, because this trusted LAN endpoint does not authenticate its peers.
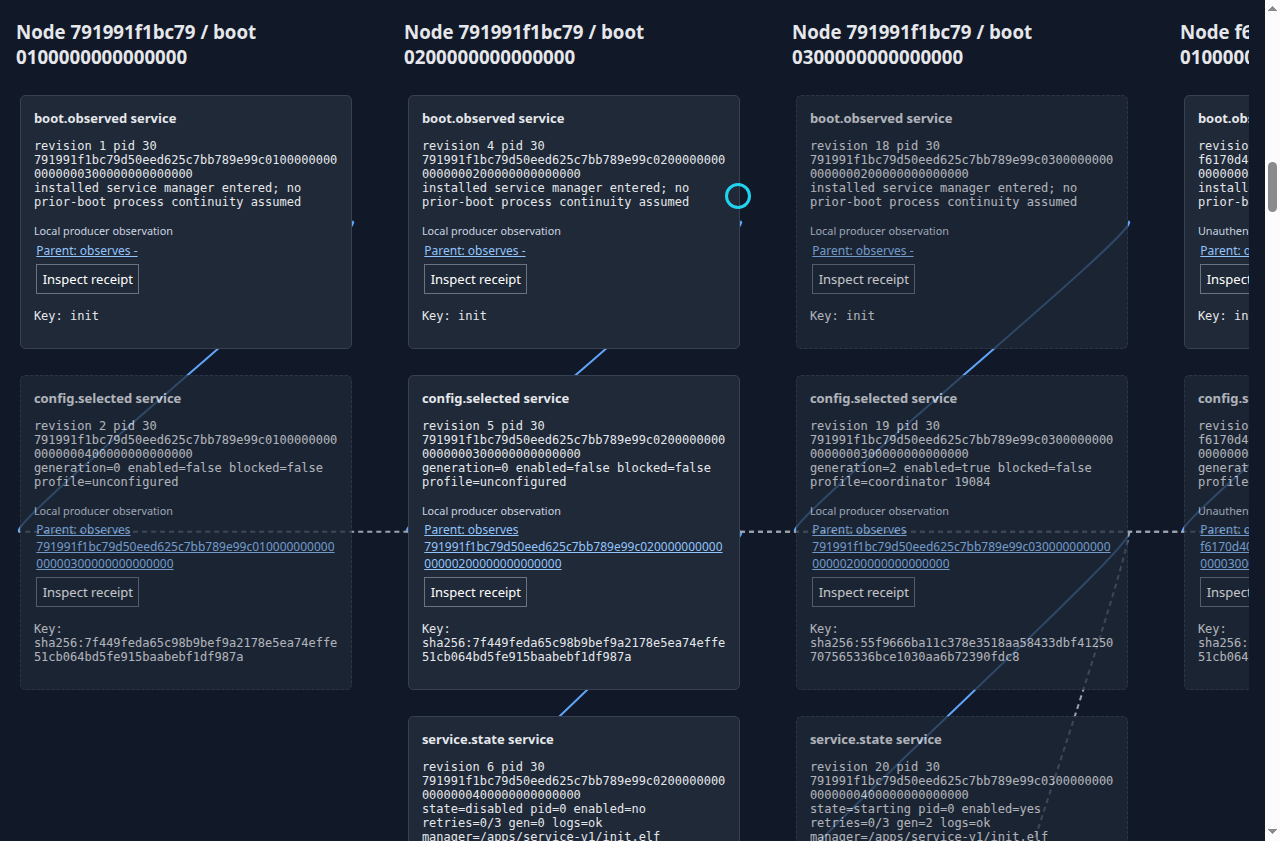
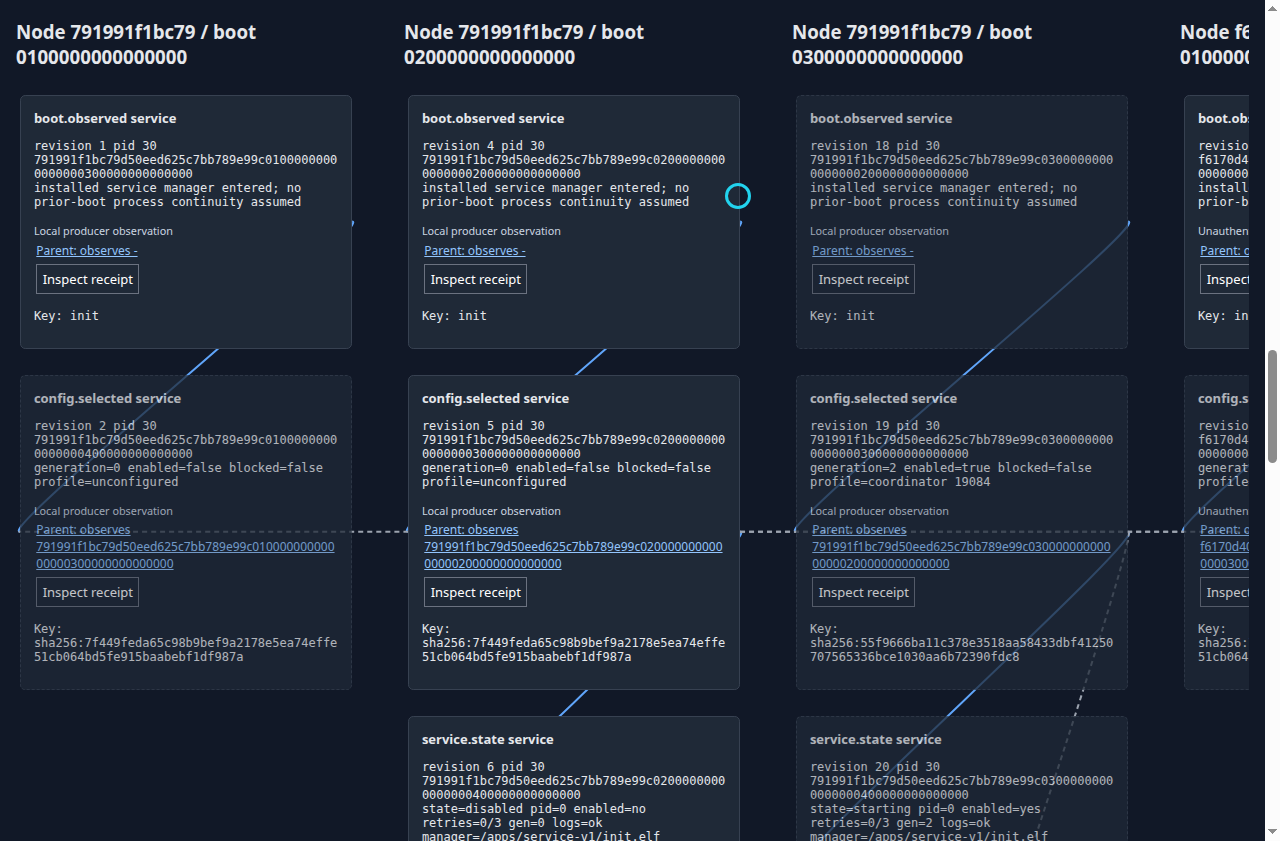
The receipt lanes separate nodes and boot incarnations. Green links are declared dependencies, blue links are observations, and dashed grey links are identity or content correspondence. Timestamp order is not promoted to causality.
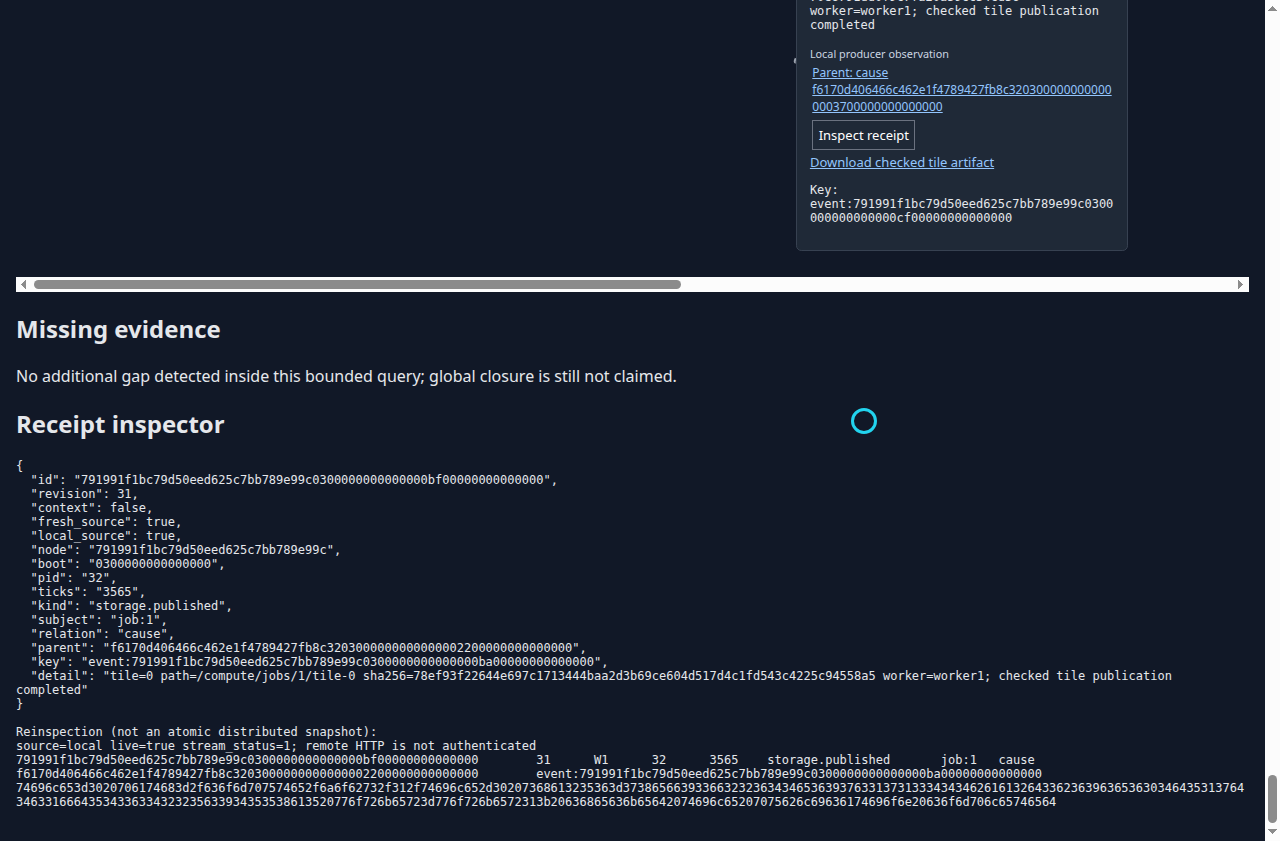
This storage publication receipt identifies the accepted tile and its assignment. The inspector reads that exact receipt again. Upload acknowledgement and transport processing alone do not establish this application commit.
The downloaded explanation contains the actual receipt identities and source coverage. These are bounded observations, with explicit missing evidence, rather than a claim of global causal closure.
02 - Explain a rebooted worker, then inspect offline evidence
Disable a worker, power cut and reboot its original volume, inspect the pending job, then take the source offline and reboot the coordinator. Finally enable the worker and verify resumed work.
134.75 seconds. Continuous 1920 × 1080 capture at 20 fps and 1× speed. The guest-served browser, coordinator serial, worker serial and operator log are simultaneous. Local synthetic Kokoro narration and on-screen captions accompany the unchanged screen timing. Use fullscreen to read the consoles.
Download MP4 · WebVTT captions · Recording proof and checksums
Narration transcript
Now a configured worker will stop across a real virtual machine power cut. The debugger runs independently of the managed renderer, so it remains available to explain the stalled job.
I disable the installed worker, then cut power and boot its original volume. Disable is durable configuration. The new kernel boot has a different incarnation, and the worker process does not start.
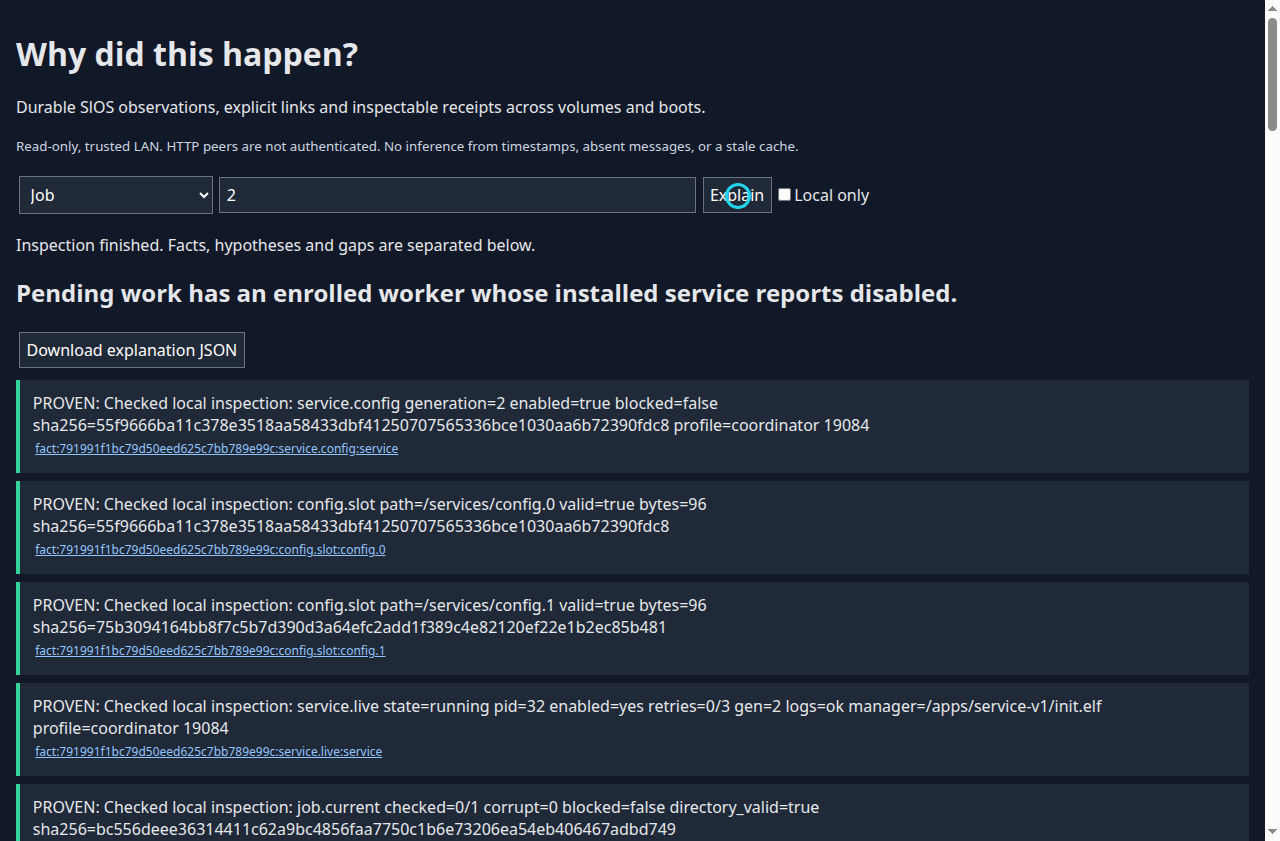
A new job remains pending. The coordinator can prove its local pending state and enrollment. The worker reports disabled. That is a plausible bottleneck, not proof that a packet was lost or work never executed.
Configuration observations connect across boots through matching content and the disable request. Dashed grey correspondence is context, not a newly invented causal edge. The receipt IDs keep the two boots distinct.
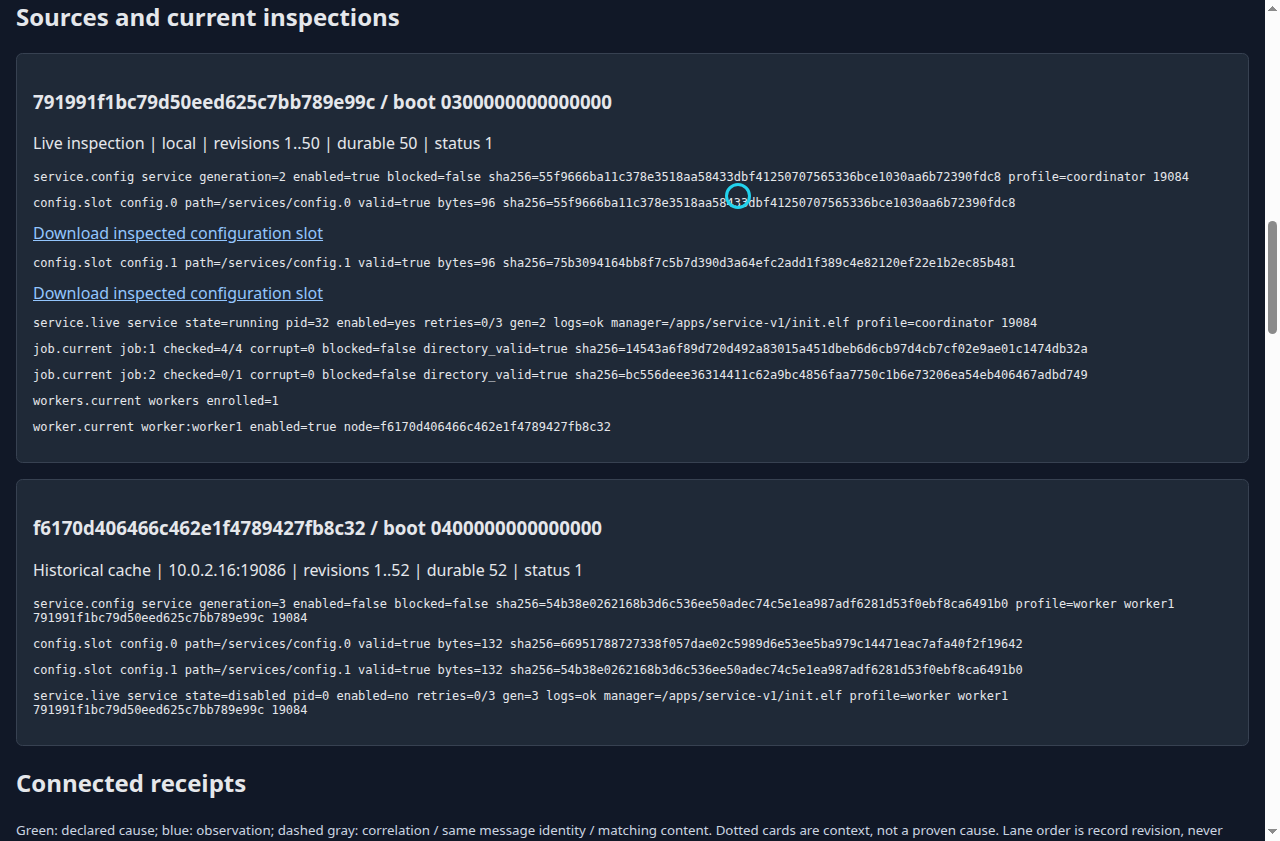
I power off the worker again and query the job. Its cached records are still inspectable, but the source is now historical. The debugger stops presenting the old disabled report as live service state.
Next I power cut and reboot the coordinator on its original volume while the worker remains offline. The persisted remote cache survives. Missing live evidence remains visibly missing after reboot.
I boot and enable the worker. Real work resumes, and the completed pixels match the independent reference. The earlier completed job also retains its exact accepted bytes.
Both machines here are native x86 sixty-four QEMU guests. This demonstration does not claim physical hardware support, authenticated HTTP peers, deterministic replay, or exactly once execution.
Inspect the recorded views
Each image is an actual browser capture from the sessions above. Open a full-size image to read the receipt identities and source details.
Reading the evidence
| Classification | Meaning in these sessions |
|---|---|
| PROVEN | A checked local inspection, such as validated configuration, the coordinator's current state, or immutable tile records with matching metadata and pixel digest. |
| PLAUSIBLE | An unauthenticated remote report or a candidate explanation. A disabled enrolled worker is a useful possible bottleneck; it does not prove packet loss or non-execution. |
| MISSING | Unavailable parents, offline sources, corruption, schema mismatch or a query limit. Cached observations retain their identities but cannot establish current liveness. |
A green edge is an explicit producer-declared dependency. A blue edge is an observation. Dashed grey lines associate the same message identity or matching content. Equal timestamps and nearby records do not supply causal edges. Producer fields, including PID, are observations rather than kernel-attested truth.
The completion decision checks published application data. Upload acknowledgement, a mailbox receipt and transport processing are separate observations. A job's persisted configuration receipt also distinguishes an incarnation from a later reuse of the same numbered slot.
Download the completed-job explanation and the offline-source explanation to inspect the actual record identities and source coverage.
Operation and validation
The installed service bundle starts the browser on port 19085 and local evidence pages on 19086. Separate listeners avoid reciprocal operator-query deadlock. They remain available when the managed renderer is stopped, disabled or failed; killing the whole init process is outside this containment boundary.
# Installed guest CLI
why service
why job 1
why job 1 --json
why job 1 --local
why event FULL_64_HEX_ID
why inspect FULL_64_HEX_RECEIPT_ID
why subject my-application

# Browser: http://GUEST_ADDRESS:19085/
# Evidence federation: guest port 19086, reachable trusted LAN
# Kernel hot-ring why remains available as:
kcmd why last
The installed ELF takes precedence over the kernel command named why. Use kcmd why for hot-ring/journal inspection. Without the installed bundle, the existing kernel command is unchanged. QEMU requires explicit forwarding for host browser access; make dev does not open these ports automatically.
Both video machines are native x86-64 QEMU guests, each booting four kernel CPUs. The worker has one user compute core. The host submits whole jobs, performs labelled power cuts and checks independent reference pixels; guest programs calculate and accept the work. These are not physical-board or CPU-scaling measurements.
Complete debugger qualification also passes on AArch64/QEMU virt. Both native targets pass the installed-service lifecycle/update/rollback gate and durable-event contract checks. The debugger checks include process-fault exhaustion, resumed real work, cache and ledger corruption, missing parents, unrelated observations, browser export and actual appends beyond the recent query window. The videos show the selected operator flows, not every qualification case.
Reproduction commands and recording provenance
# In existing SlOS + local Hew consumer checkouts
make -j1 causal-debugger-check ARCH=x86_64 DOOM=0 HEW=/absolute/path/to/hew \
  CAUSAL_DEBUGGER_BROWSER_PYTHON=/path/to/playwright-python
make -j1 causal-debugger-check ARCH=aarch64 BOARD=qemu_virt DOOM=0 \
  HEW=/absolute/path/to/hew CAUSAL_DEBUGGER_BROWSER_PYTHON=/path/to/playwright-python

# Re-record the two actual x86-64 guest sessions, with local speech
make -j1 causal-debugger-videos ARCH=x86_64 DOOM=0 HEW=/absolute/path/to/hew \
  CAUSAL_DEBUGGER_BROWSER_PYTHON=/path/to/playwright-python \
  KOKORO_PYTHON=/path/to/kokoro-python \
  KOKORO_MODEL=/path/to/kokoro-v1.0.onnx \
  KOKORO_VOICES=/path/to/voices-v1.0.bin
The capture used the qualified local working tree and the unchanged hew 0.9.4-dev.28+95340fc71a compiler. This is Slepp's local freestanding port, not an official Hew release or target. The media manifest identifies the recording session, exact delivered and source-capture hashes, durations and local speech assets. Native check evidence remains in the private development checkouts; whole binaries and disk images are not published.
The MP4s pass complete FFmpeg decode and actual Chrome playback/seek checks with decoded video and audio. Speech is generated locally using Kokoro's af_heart voice, with explicit technical-term pronunciation. The Kokoro model is Apache-2.0 licensed; its ONNX wrapper is MIT licensed.
Trust and retention limits
HTTP federation is unauthenticated and intended for a trusted LAN. CRC and unkeyed SHA-256 detect damage; they do not authenticate a peer or a claim. This browser view does not inherit authentication from SlOS's encrypted actor mesh or signed journal facilities.
The causal stream is bounded at 4 MiB with no automatic eviction. An explanation reads at most 256 recent records per source across eight volumes, selects at most 96 root/descendant receipts and 128 including ancestors/context, and performs at most eight older-parent lookups. Omitted history and exhausted budgets remain explicit. Offline caches retain only their bounded windows.
Current inspections are separate reads rather than an atomic distributed snapshot. The debugger does not establish global causal closure, deterministic replay, exactly-once execution, universal instrumentation or hardware power-loss durability.
Continue with kernel causal history, the local Hew platform, or the historical showcase.